Table of Contents
The process of data discovery
A fictive data discovery story with roots in reality

Jana Svoboda is an economist and works in a public research institute in the Czech Republic. She needs international comparative data on work orientations. How did she discover and access such data?
In preparation of her research project, Jana takes the following steps to find relevant data:
- She reviews the literature on the topic
Jana begins with a review of scholarly literature and looks for data used by other researchers. She has read a number of studies on the topic before and now she reviews the ”research method” and ”data” sections in articles to learn about the data and the data resources. The authors mention several publicly available datasets, that may be used in Jana’s research. The study of the International Social Survey Programme (ISSP) on Work Orientations is among them. However, only a few datasets are properly cited and the persistent links (DOI) are missing for most of them. She must look elsewhere to find out details about the ISSP Work Orientations studies.- She looks for data at the survey programme website
Jana visits the ISSP website (ISSP, n.d.). There she finds general information about the Work Orientation surveys, methodology and participating countries. She downloads the international module questionnaire, i.e. the source questionnaire written in English whose translation was used in individual countries. This questionnaire contains all variables measured in all ISSP countries in 2015. Jana reads the questionnaire and finds out that it contains variables that she might use in her study. She follows the link to the ISSP data archive at GESIS (GESIS, n.d.a). The archive provides rich metadata from each ISSP survey and enables users to download data for scientific research and teaching purposes. Via the Data and Documentation page she could view ISSP Modules by Topic , and choose the Work Orientations series. From here she could finally reach the land page for the Work Orientations I-IV Cumulation dataset. After registering, she could download a dataset with data from Work Orientation surveys that were conducted in many countries in 1989, 1997, 2005 and 2015.- She searches for data in social science data archives
Jana searches the GESIS data catalogue also for other data on work orientations. Besides the ISSP, there are over a hundred other studies. However, they are not comparative by nature or the topic of work orientations is not so central. Jana decides to visit the Czech Social Science Data Archive (CSDA, n.d.) to look for data that give her a more detailed view on work orientations in her country. She finds out that ISSP Work Orientation datasets which only contain data from the Czech Republic, include variables that were not part of the international “core” questionnaire and were measured only in Czechia. These country specific variables allow Jana a more detailed and deeper analysis of work orientations.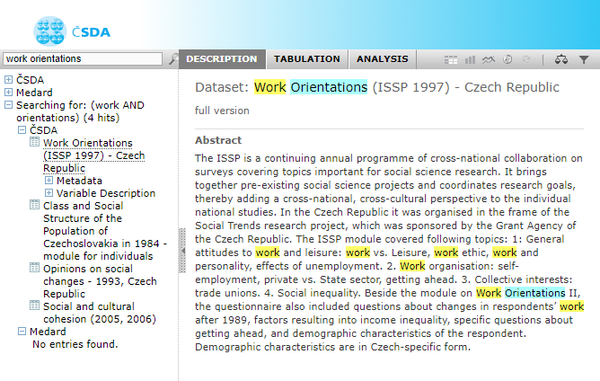
- She searches for other data on the web
Jana wants a complete picture of the available data, so she continues searching. She uses Google and employs various keywords such as statistics, surveys or questionnaires and combines them with her research topic (work orientation OR attitudes towards work OR labour force). Jana learns about a few interesting organisations which host datasets on work orientations such as the European Working Conditions Surveys (EWCS), one of the datasets maintained by Eurofound (Eurofound, n.d.).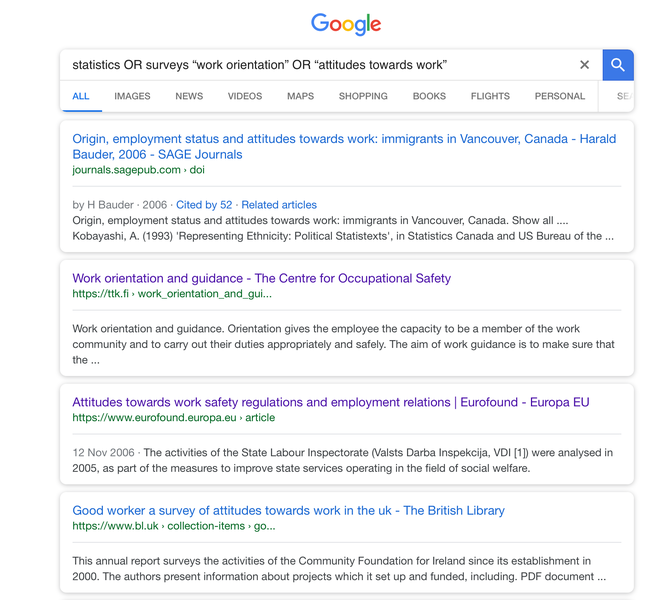
Each empirical research project should start by searching for existing data resources relevant to the research topic. This is essential for projects based on secondary analysis (which reuse data produced by another research project), but also important for projects that intend to collect original data.
When you discover existing data, you can use them to your advantage in the following ways:
A disadvantage of using existing data may be that the research design is set and you must be satisfied with the exact wording of questionnaire items, population, sampling etc. Moreover, you can not influence the quality of data (Gregory, et al., 2018a). Therefore, the quality of the metadata must be as high as possible, so that you have sufficient information to decide whether or not you want to use the data.
Steps in data discovery
Data discovery is a process of several distinct - and cyclic - steps. You can structure your search according to the steps below (inspired by Gregory, et al., 2018b):
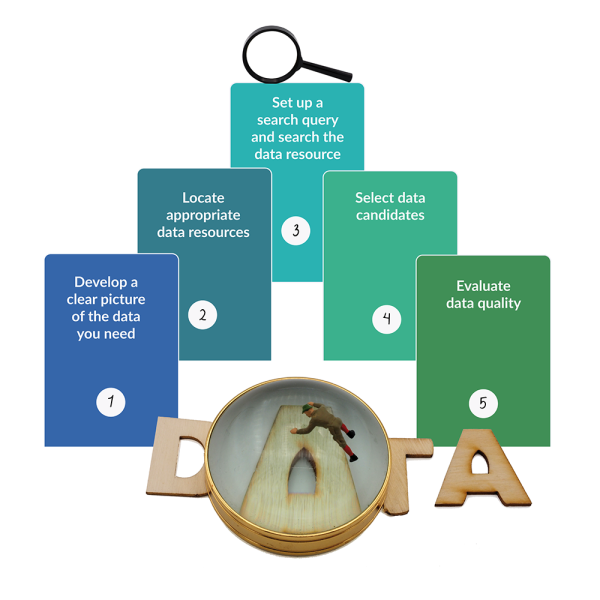
In the process of data discovery, it’s important to be aware of the type of data you are looking for. What data fit your research intentions?
The term ”research data” can be broadly understood as any data usable in research, or more narrowly, as data produced for research purposes. In this guide, we focus on data generated in social science research. Some data sources specialise in certain types of data. Specifically, there are different methodologies and different types of data used in quantitative and qualitative social science research. Please read Chapter 1 for an introduction to the different types of research data and concepts of quantitative and qualitative data.
Listing the characteristics of the data you want to discover makes it easier:
- to formulate the right search terms to find sources which hold such data;
- to search the data source of choice for adequate data.
To develop a clear picture of the research data you want to discover and use, ask yourself:
Before you start looking for data, you must be sure which theme or domain you are interested in. It may be politics, health, family, social inequalities etc.
Before you start looking for right data for you, you must be sure about your research intentions. What is your research question? A research question is one or more questions that your study wants to answer. For example: “Do reading habits in childhood relate to attained education?” or “Are anti-immigrant sentiments related to age and education?”
Your research question contains several constructs, i.e. scientific concepts developed for systematic inquiry of the issue. Examples of such constructs are ”employment”, ”attitudes to immigration”, ”age” or ”education”. When you are looking for appropriate data for your research, look out for indicators of such constructs. In survey research, these indicators are the variables contained in the dataset. The construct of ”education” may have various indicators, the most common being ”highest completed education” measured in (standardised) categories, or ”years of schooling” measured in total years spent by a respondent in schools.
There also exist complex concepts that use information from more than one survey question/indicator. For example, political participation is a multidimensional concept involving voting, organisation membership and demonstrating etc.
What indicators of constructs do you need to find in the data? Do you have a preferred level of measurement for your key variables, i.e. are you looking for variables measured on nominal, ordinal or interval level?
Does your research follow a previously developed theory? It definitely should. Look for concepts and their indicators that were previously used by other researchers to answer your research questions.
E.g. you may want to use the data for a:
Examples:
- You will use one or multiple data sources, you may combine micro (individuals) and macro (countries) level;
- You may use only secondary data or you may combine secondary data with primary data, i.e. the data you collected within your project (“your data”);
- You want to use the design/methodology from some other study;
- You want to use some features of study/questionnaire in your own study (interview schedules, measurement instruments, sampling strategies etc.).
You are repeating/replicating a study that was carried out earlier by you or somebody else.
You want to use data in teaching, perhaps datasets that were made specifically for training purposes, such as easySHARE (SHARE-ERIC, 2018) or the AUSSDA Teaching and Learning Dataverse (AUSSDA, nd).
First make a detailed plan of your study and specify its key characteristics (Babbie, 1998):
- Will you use survey data (= answers of respondents on standardised questions) or other types of quantitative data (e.g. administrative data, social media data etc.)?
- Secondary analysis of qualitative data is less common and qualitative data are less available from data repositories; however, opportunitities exist to reuse qualitative research outputs in a new analysis and also when designing new research projects.
- Who is your target population? Adults, children, country citizens, migrants, local authorities, single mothers etc.
- What is the unit of analysis? Individuals, households, regions, countries etc.
- Do you need a large representative sample? If you need data to be representative of a specific population, you most likely need to find data from a sample taken using random sampling techniques. To use data from a quota sample is also possible, such a data are representative for the population in characteristics as gender, age, education etc.
- What geographical area do you want to cover? A specific country, a specific region, all EU countries etc.
- Do you want data from one country or are you going to use data from different countries?
- Do you need national data (concerning the population of only one country)?
- Do you need international data (concerning the population of several countries, where the methodology is the same in each country and the data are comparable across countries)?
- What is the desired time scope?
E.g:
- As recent as possible;
- Data from a precise point in time (e.g. 2008);
- Data from several specific time points (e.g. 2009 and 2014);
- Longitudinal data covering a time span to track differences in time;
- Cross sectional data (to analyse data from a population, or a representative subset, at a specific point in time);
- Longitudinal (or panel) data (where the same respondents are asked repeatedly (in two or more data collection waves));
- Repeated cross sectional data (where the survey design is repeated on a different sample of respondents; respondents in the “Sample t” are different respondents than in the “Sample t+1”).
E.g.:
- Do you need a specific file format?
- Should the data be available right away in open access or is restricted access also an option?
Once you have developed a clear picture of the data you need, you will need to locate appropriate data resources which may host such data.
Depending on what you already know about ”data repositories out there”, you will probably proceed from one of the following points:
- You know appropriate data resources (or know who to ask)
You are already acquainted with trusted data resources on your research topic, e.g. from:- colleagues close by or colleagues you have met at conferences, training events, etc.;
- curated lists of data sources such as those in the paragraph 'Data repositories as data sources' in this chapter.
- You are not yet familiar with possible data resources (and don’t know who to ask)
How do you discover such data resources if you do not know they exist? To discover data resources from scratch, consider using the following instruments:
A registry of data repositories is a tool that offers researchers a searchable overview of many existing repositories for research data. E.g.:
- Re3data.org (n.d.) is a registry of research data repositories which lists over 2000 data repositories from all research disciplines. You can search by subject, content type and country. In addition, you can set some specific conditions, e.g. limiting the search to data repositories with a certificate (a trusted repository), which host data sets available via open access or which have a persistent identifier.
- OpenAIRE Explore (OpenAIRE, n.d.a) provides a searchable registry of open access compatible repositories.
- With OpenDOAR (Jisc, n.d.), the Directory of Academic Open Access Repositories, you can browse over 3500 academic open access repositories. It enables users to identify, browse and search repositories based on a range of features, such as location, software or type of material held.
- FAIRsharing (n.d.) groups together resources (standards, databases or policies) by domain, project or organisation. It has its roots in life sciences, so the list of data repositories belonging to the domain of social sciences is not very long.
You can use (specialised) search engines or (meta)data aggregators for discovering relevant data sources. Examples are:
| |
You can use Google to discover organisations which hold data sets on your research topic. Apart from keywords which describe your research topic, it is important to add keywords such as ”datasets” or ”data archive” to your search query. The advantage of this approach is that you will most surely look beyond the usual suspects. Google indexes trillions of web pages. The disadvantage may be that it costs you time to filter the results. 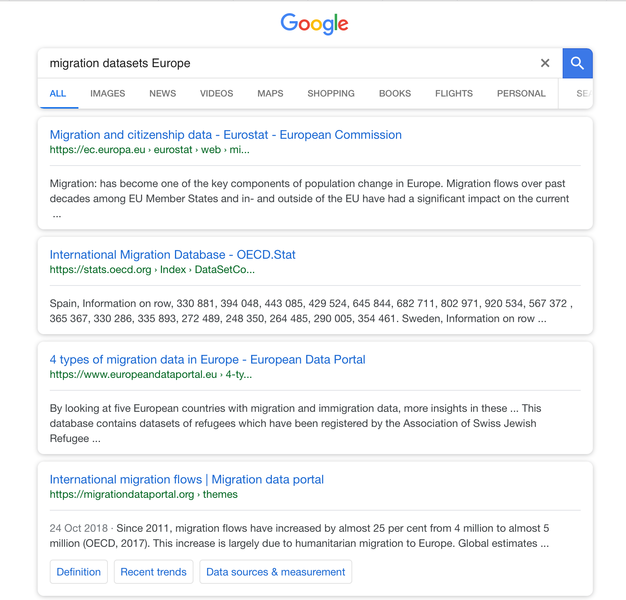
|
| Google Dataset Search |
Google developed a tool for data search: Google dataset search (Google, n.d). The advantage is that results are already limited to data sets. The disadvantage is that you do not know what selection of data sources Google dataset search searches, so some choices have been made for you. If you do not find appropriate data it doesn’t mean they do not exist. What isn’t indexed, cannot be found. 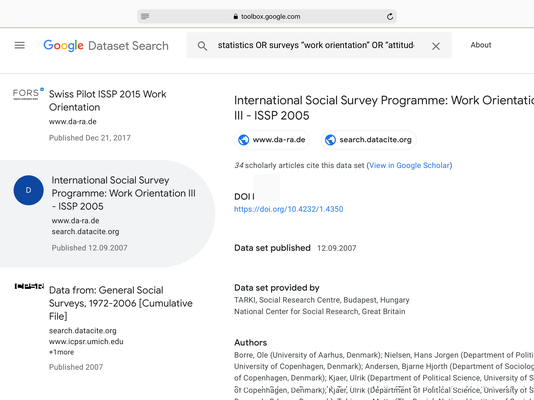
|
| (Meta)data aggregators |
DataCite OpenAIRE Explore |
Domain aggregated data catalogues index specific selections of data resources. In the European research area the most important is the CESSDA Data Catalogue (CESSDA, n.d.a) which contains the metadata of all data in the holdings of CESSDA's service providers. It enables effective access to European social science research data. The Catalogue’s search engine enables filtering by topic, data collection years, country or language. The advantage is that you do not have to query every CESSDA data archive separately. The disadvantage is that you will not find data which weren't archived by CESSDA members.
For more information about important social science data archives, visit the section 'Data repositories as data sources' in this Expert Guide.
You can look for data (or rather data citations) in research papers or scholarly articles. But there is another option as well. You can use specialised data journals which publish descriptions of scientifically valuable datasets, and research texts on the sharing and reuse of scientific data. Important examples are:
- Research Data Journal for the Humanities and Social Sciences (Brill, n.d.) is published by Brill in collaboration with DANS (one of the CESSDA archives).
- Scientific data (Nature, n.d.) is a “branch journal” to Nature. It is mostly dedicated to natural sciences data, but publishes data articles from other fields of science too.
Expert tips

Look out for trusted data resources
If you locate an appropriate data resource, don’t forget to carefully determine the authority of the party which hosts the data. Is the data resource maintained by a trustworthy organisation?The importance of indexing
Determine which data resources your search instrument indexes. Remember: What isn’t indexed, cannot be found and may need to be discovered via a different strategy.
Once you find a data resource which hosts the type of data you are interested in, you should find out how to search in the data archive or repository of choice. To translate your needs into a search request, you will have to find out what search functionalities the data resource offers. Such search functionalities differ for each individual search system.
Generally it is advised to:
When you have selected a data resource, familiarise yourself with the system the repository uses for organising data. What information about the data is contained in the repository catalogue? What metadata fields are offered? Be aware that searching in the repository catalogue mostly means that you search through the metadata (not in the data itself). This means that the quality and completeness of your results depends on both the quality of metadata and your ability to formulate the appropriate search terms for finding the data you need.
You can find more about metadata in chapter 2 of this Data Management Expert Guide. CESSDA archives (and many more social science data repositories) use the DDI metadata scheme (DDI Alliance, n.d.). As a result, in the data catalogues of all CESSDA archives, metadata are structured in the same way.
As a registered user you will be able to use more services and functions. Also, registration allows the repository to inform you, e.g. to send you alerts about datasets that you have previously downloaded.
It always pays off to explore the (advanced) search options which the data source of choice offers, e.g:
- Does it offer truncation?
Truncation is a searching technique used in databases in which a word ending is replaced by a symbol. Frequently used truncation symbols include the asterisk (*) and a question mark (?). - Does it offer wildcards?
Wildcard symbols can be typed in place of a letter or letters within a keyword if you are not sure of the spelling or if there are different forms of the root word. E.g. The wildcard symbol that should be used is usually an asterisk (*) or question mark (?). - Can you use boolean operators?
Boolean search allows you to combine keywords with operators such as AND, NOT and OR. Be aware that there might be a default boolean operator which is applied standard. - Can you use proximity operators?
A proximity operator is a character or a word (such as NEAR) used to narrow down results by limiting results to keywords which occur within a specific number of words in the content. - Can you search in the data themselves or in the metadata only?
When you can search in the data themselves your query will probably be more exact than when you are searching in the metadata (descriptions of the data) only. - Is a controlled vocabulary or thesaurus (predefined keywords to choose from) available?
A controlled vocabulary or thesaursus is a preselected list of terms used for the description of information, in our case for the description of datasets. The controlled vocabulary used in social sciences is ELSST - European Language Social Science Thesaurus (UK Data Service, 2018). - Can you filter results?
Can you use refinements such as data format, types of analysis, and data availability?
In case you cannot find data (that you know should exist), ask the data service provider. Such user enquiries can help providers develop their collections; if they don’t have the data, they may try and find out how to acquire it for future data sharing.
Adjusting your search strategy
When searching for data, you can retrieve too many (mostly irrelevant), too few or no results. How to adjust your search strategy when you do not find what you are looking for?
Assuming that data can be found in the data source of your choice, you can try to rephrase your search query. Some tips:
For example:
You are looking for data that reflect the concept of ”postmaterialism”. If you type ”postmaterialism” into the ”question text” field search, the search will retrieve nothing because the word ”postmaterialism” is not included in the wording of the respective questionnaire item. Items dealing with ”postmaterialism” usually ask respondents about particular attitudes (e.g. ”Maintaining order in the nation” or 'Giving the people more say in important political decisions'). You can look for ”postmaterialism” in the ”keywords” field or ”concept” field or try to find other keywords that will be useful in searching, e.g. by consulting the controlled vocabulary or thesaurus, when available.
Too few or no results? Consider broadening your scope by:
- thinking about all the terms that relate to your research domain;
- using fewer search terms in the search field;
- being less restrictive when using search operators;
- being less restrictive with using filters.
Too many and mostly irrelevant results? Consider narrowing your scope by:
- choosing more detailed search terms;
- using more words in the search field;
- being more restrictive when using search operators;
- being more restrictive by using filters.
Case: Example of using ELSST
A little about ELSST - European Language Social Science Thesaurus
ELSST (UK Data Service, 2018) is social science multilingual thesaurus that was developed to aid cross-language information retrieval of social science datasets. It contains thousands of terms corresponding to social science concepts, enables users to find terms related to concepts and provides their detailed specification. The thesaurus covers the core social science disciplines: politics, sociology, economics, education, law, crime, demography, health, employment, information and communication technology and, increasingly, environmental science.
ELSST is available in 14 languages: Czech, Danish, Dutch, English, Finnish, French, German, Greek, Lithuanian, Norwegian, Romanian, Slovenian, Spanish, and Swedish. In the near future, it will be used for data discovery within CESSDA and will thus facilitate access to data resources across Europe.
Using ELSST
Imagine the situation when you are looking for data that relate to work. You want to find the best search term to effectively find relevant data. You start using ELSST by typing 'work' into the ELSST search engine (UK Data Service, n.d.a) and find out that:
- The preferred term for ”work” is ”employment”. This means that if you are looking for data relating to ”work”, you should use ”employment” as a search term and not ”work”.
- ELSST shows you a list of 14 language equivalents for ”employment”'. You can use the translation of the term when you search in catalogues in other languages. It can also help you when you are simply looking for equivalent terms in other languages.
- ELSST shows how employment relates to:
- Broader terms (BT)
Concepts that are at an overarching level to ”employment”, in this case ”Labour and employment”.- Narrower terms (NT)
More detailed phenomena related to ”employment” in general. In this case ”youth employment”, ”job creation” etc.- Related terms
For ”employment”, examples of related terms are ”employment policy” and ”right to work”.
When you find data you should ask yourself whether the data seem relevant for your research question. To fully evaluate the suitability/usefulness of data you usually need to scrutinise the documentation described in step 5.
If the data do not seem relevant, ask yourself why you found data that are off-topic? What does this tell you about how you have used the search functionalities of the data source? Return to step 3 or even to earlier steps in the data discovery cycle if necessary and adjust your search strategy.
Expert tips

Check appropriateness of concepts
Bear in mind that the concepts you find in the data should be the same as the concepts from your research question.Use appropriate indicators
Evaluate how well indicators/questionnaire items/variables apply to your concepts. If you use indicators/variables that do not fit to your concept, your study will lack validity.
What quality should you demand from the dataset you have selected as a potential candidate for your research? To determine data quality, familiarise yourself with its content and get a detailed notion about what is in it and what isn’t. Think about how the data were collected and ask yourself questions such as:
- What information was collected, from whom, when and where?
- Who collected the data and when?
- Why was the data created? E.g. different purposes for data collection are research, social policy, marketing etc.
- How was the data collected? You need detailed information about the methodology.
- How was the data processed? Were there any changes in data? Who adjusted data in what way after it was collected? To which manipulations was the data exposed?
- Were consistency and logic checks employed? Is the data ”clean”, i.e. were nonlogical and erroneous values deleted?
- What quality assurance procedures were used? Did researchers use verified measurement tools?
The information about the data you always need to know is twofold:
Project-level documentation explains the aims of the study, what the research questions/hypotheses are, the methodologies, instruments and measures being used, etc. Survey data project level documentation also contains detailed information about data collection, respondents, measurement tools, data manipulations etc. It includes user guides, survey questionnaires, interview schedules, fieldwork notes etc.
Data-level or object-level documentation provides information at the level of individual objects such as pictures or interview transcripts (qualitative data) or variables in a dataset (survey data).
You can find more detailed information about what quality you should demand from your data and the accompanying documentation in the Documentation and metadata paragraph of Chapter 2.
Expert tips

Determine data quality before download
In domain data archives, documentation and metadata is usually publicly available without the need to register as a user. Therefore, you can read it before you download the dataset.Look out for high quality data documentation
In trusted repositories (such as CESSDA archives), data is accompanied by project-level and data-level documentation. Such documentation can usually be found in documents called user guide, fieldwork notes, technical report or readme files.Look out for clean data (or clean them yourself)
The data you download from the data repository may be 'clean', i.e. the values of variables have been checked for logical consistency and illogical values have been filtered off. But in some cases, datasets will not be cleaned. In this case you will have to make necessary consistency checks.
Expert tip

- Prevent filter bubbles
Don’t be satisfied with your preferred method of data discovery. In order to prevent operating in filter bubbles, you should invest enough time in using a mixture of strategies and in visiting multiple sources to find data. In this way you have a chance to locate data which are hard to find or to find data which do not belong to ”the usual suspects” (Gregory et al., 2018a).